Intra-Year Volatility For The S&P500
September 25, 2020
Since the recent market highs in early September, the market has experienced consistent downward pressure. On Thursday, for example, the S&P 500 sold off in the morning and put the market into correction territory (defined as a >10% decline from its peak). The market then proceeded to close in positive territory for the day. While unpleasant, these sorts of selloffs – corrections, Bear markets, etc. — are a normal part of investing in equity markets.

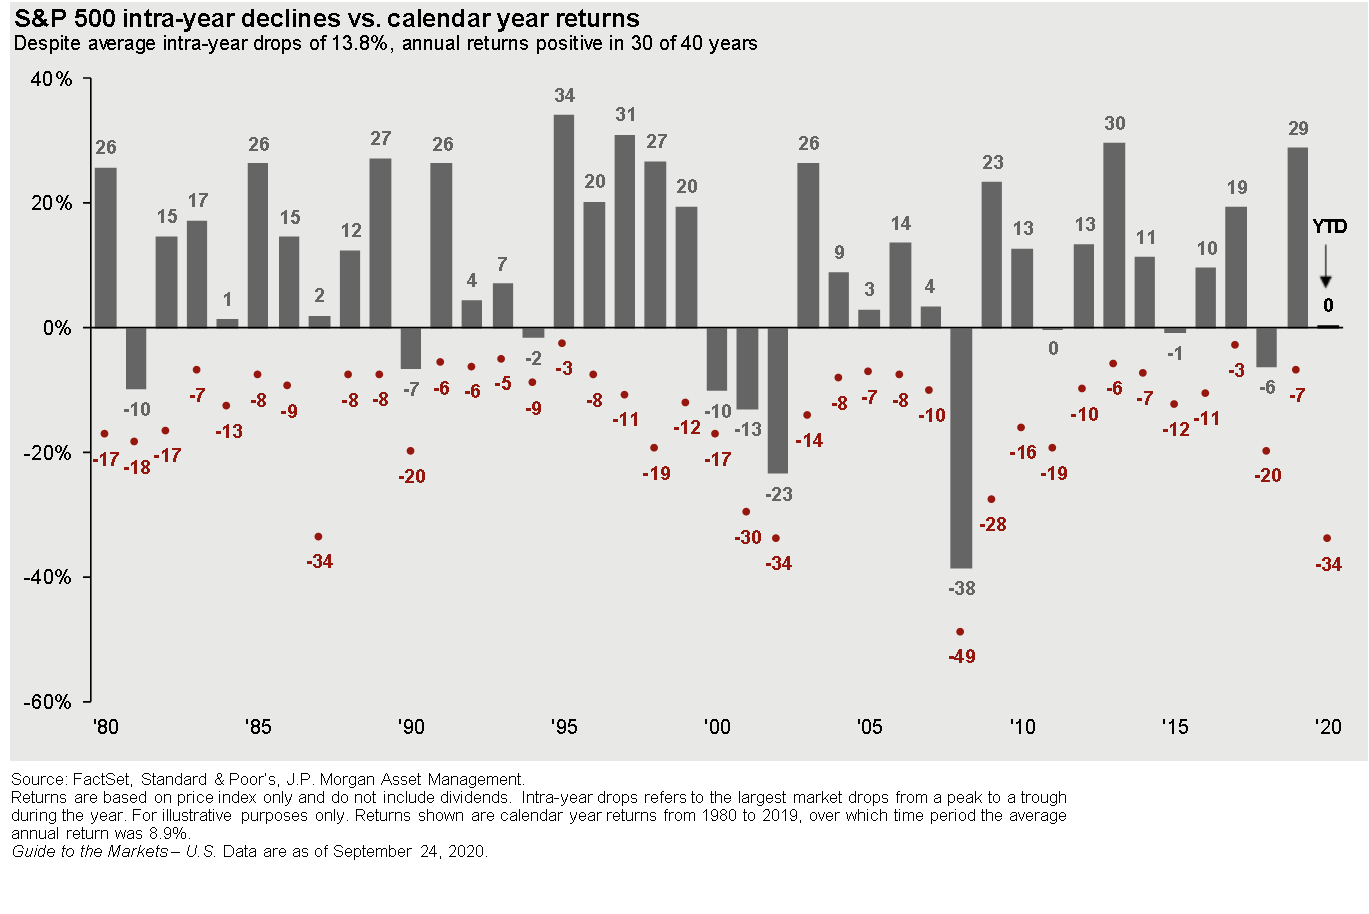
As you’ll see in the graphic above, the S&P 500 regularly experiences intra-year volatility. The red dot in the graphic illustrates the intra-year low in that specific year. The gray bar illustrates the total return of the market that calendar year.
From 1980-2020, the average intra-year decline has been 13.8%. Even though there has been substantial intra-year volatility, the market has been positive 30 of the last 40 calendar years. The average annual return over that time period has been 8.9%. In order to earn the market’s average return, you’ve had to ride out some very volatile periods. In stock market investing as in life, “there is no such thing as a free lunch.”
It is of course easy to look at a graph and say, “I can ride out these down periods.” In reality, each significant intra-year decline is generally (but not always) tied to a significant global event (Covid, GFC of 2008-2009, 9/11, etc.).
Depending on your stage of life, you may be asking yourself if you’re doing the right thing for your family, your retirement, or your future by staying the course. This is of course even more difficult if you haven’t developed a plan and strategy at the outset including an allocation that is within your comfort zone.
Part of the strategy that we implement for our clients focuses on companies that pay dividends and have historically raised their dividends each year. The rationale behind focusing on these “dividend raisers” is partly to help get through these difficult times.
If you’re getting paid dividends each year, and your dividends are increasing each year, it’s conceivably easier to ride out choppy periods.
Why the Return from Dividends Matter
Eddy Elfenbein describes how dividends are commonly overlooked but add significantly to the total return of a portfolio over a long period of time. The approximate yield of the S&P 500 of the last 30 years has been about 2%. This is a seemingly small amount. However, on average those dividends have risen over that period of time.
To illustrate his point, Elfenbein compares the return of the S&P with dividends to the return of the S&P without dividends over the last 30 years. Over that time, the total return of the S&P (with dividends) is more than 2X just the price return of the index (without dividends).
We hope everyone has a happy and safe weekend. Please give us a call if you have any questions.
Disclosure:
This newsletter contains general information that may not be suitable for everyone. The information contained herein should not be construed as personalized investment advice. Past performance is no guarantee of future results. There is no guarantee that the views and opinions expressed in this newsletter will come to pass. Investing in the stock market involves gains and losses and may not be suitable for all investors. Information presented herein is subject to change without notice and should not be considered as a solicitation to buy or sell any security.
Links to third-party web sites are provided as a convenience. Stokes Family Office, LLC does not endorse nor support the content of third-party sites. By clicking on a third-party link, you will leave this website where privacy and security policies may differ from those practiced by Stokes Family Office, LLC.
*Stokes Family Office does not offer legal or tax advice. Please consult the appropriate professional regarding your individual circumstances.