Historical Perspectives on the Inverted Yield Curve
April 14, 2022

A DEBRIEF OF Q1.
After an exceptional run in 2021, the first quarter of 2022 was challenging for financial markets. Reflecting on the last three months, it’s difficult to remember a quarter in which markets had to digest so many negative headlines seemingly all at once. Noting every headline or major global event that took place in the first quarter of 2022 would take up an entire page, so here’s a (very long) one-sentence summary: Russia’s invasion of Ukraine in late February caused a global shock and led to soaring commodity prices, which contributed to a further surge in inflation and caused concern over the potential need for a faster pace of interest rate hikes, leading to a U.S. Treasury inverted yield curve.
WHAT IS A YIELD CURVE INVERSION?
There has been a lot of news chatter in recent weeks warning of a looming recession for the U.S. economy, primarily citing the inversion of the yield curve in early April as evidence. Simply put, a yield curve inversion occurs when short-term debt yields more long-term debt of the same quality.
The Fed generally guides short-term interest rates via monetary policy, but long-term interest rates are determined by investor demand — the more demand, the lower the yield and vice versa. It makes sense that the yield curve generally slopes upward, as investors require a 10-year bond to yield more than a 2-year bond to compensate for the additional holding period risk. However, the demand for long-term bonds increases when investors become wary of potential economic weakness. This abnormal demand for long bonds drives yields lower, which in turn causes the curve to slope downward, or invert. Inversions can and do happen at any two maturity points along the curve. For simplicity, this post will exclusively focus on the 2- and 10-year maturities of the U.S. Treasury curve.
WHY DO INVESTORS CARE WHEN THE YIELD CURVE INVERTS?
Historically, yield curve inversions have been a reliable predictor of coming economic recessions. The chart below shows that every recession since the mid-1970s (the gray shaded regions) has followed an inverted yield curve when the two-year note yields more than the 10-year:

1: FRED
As we know, predicting market returns or periods of economic decline is an impossible task. Although it seems counterintuitive, the stock market and economy often move in opposite directions. To illustrate this point, let’s look back at a few different time periods:
On a calendar-year basis since 1930, the correlation between the S&P 500’s total return and the change in real GDP is 0.25. Over longer time periods, the correlation between economic growth and stock market returns has been much higher but attempting to predict how a single economic indicator will impact market returns in any given year has proven to be futile. Shifting the focus back to the recent yield curve inversion, the same dynamic applies. The table below illustrates forward returns of the S&P 500 index after each of the last six yield curve inversions.
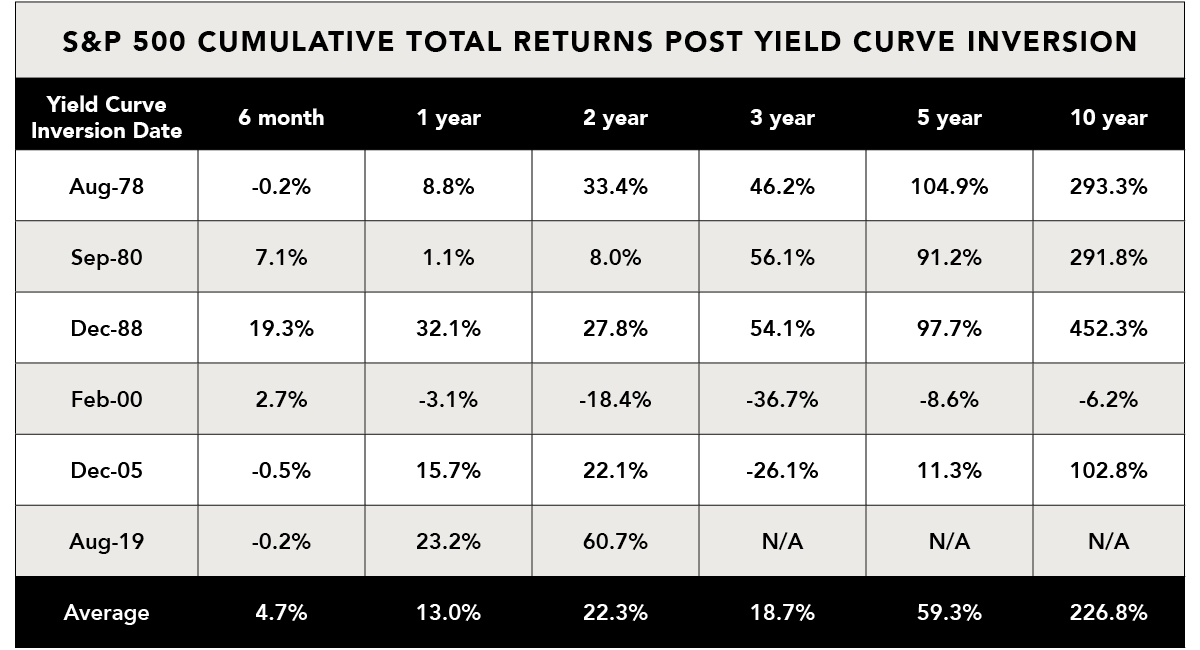
2: Bloomberg
February 2000 is the only inversion in which equities produced negative total returns over the following 5 and 10 years. As you may know, 2000-2010 is one of the worst decades in the history of financial markets. It started with the Tech Bubble, witnessed the terrorist attacks of September 11th, and ended with the worst financial crisis our country has seen since the Great Depression. It is fair to say that the yield curve inversion in February of 2000 is not the reason for a decade of negative returns.
Hearing news pundits claim that a recession is inevitable because of the recent yield curve inversion is similar to hearing a meteorologist say that it’s going to rain at some point in the future because clouds are in the sky – both statements are technically true, but not very insightful. History shows that there has been a substantial lag (typically between 14-24 months) from the time the yield curve inverts to the start of a recession. The table above shows that equities have historically produced strong returns in the time periods following a yield curve inversion. Sometimes, as unsatisfying as it may be, the best course of action is inaction. Investors have historically been rewarded for having a long-term mindset, and there is no evidence that points to that dynamic changing anytime soon.
Sources:
*Stokes Family Office does not offer legal or tax advice. Please consult the appropriate professional regarding your individual circumstances.