The Stokes Family Office Q1 Review
April 3, 2026

KEY TAKEAWAYS
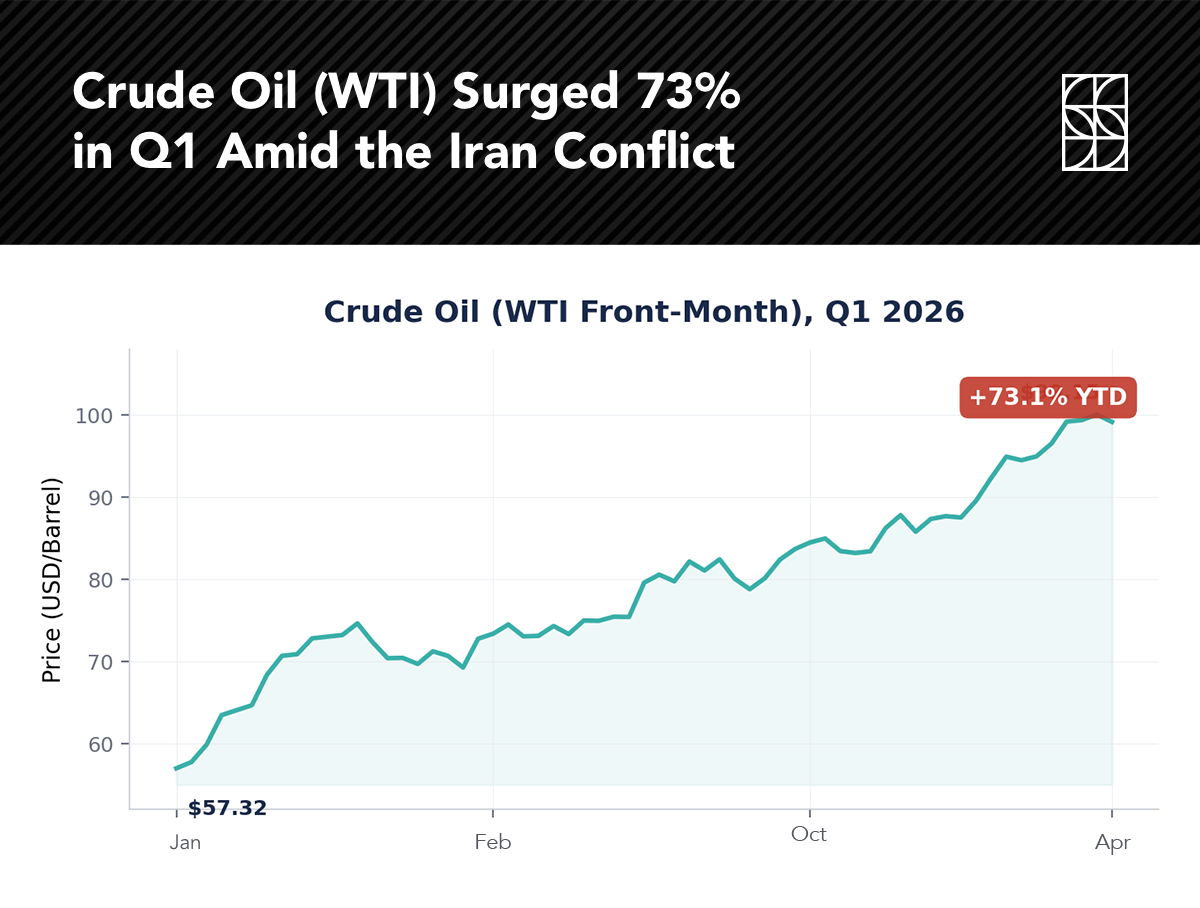
The first quarter of 2026 delivered a textbook reminder of why disciplined, diversified investing matters. January optimism gave way to February unease, followed by a more pronounced equity decline in March as the U.S.–Israel military engagement in Iran escalated and the Strait of Hormuz, through which roughly 20% of the world’s daily oil supply transits, came under threat.
Crude oil surged from under $70 per barrel in early January to above $100 by quarter’s end, representing the largest supply disruption in global oil markets since the 2022 Russia–Ukraine crisis, according to the International Energy Agency. Gasoline prices rose above $4.00 nationally, with California averaging over $5.00. Despite the shock, diversified investors generally weathered the quarter well—and the historical record suggests that periods like this, while uncomfortable, tend to reward patience.
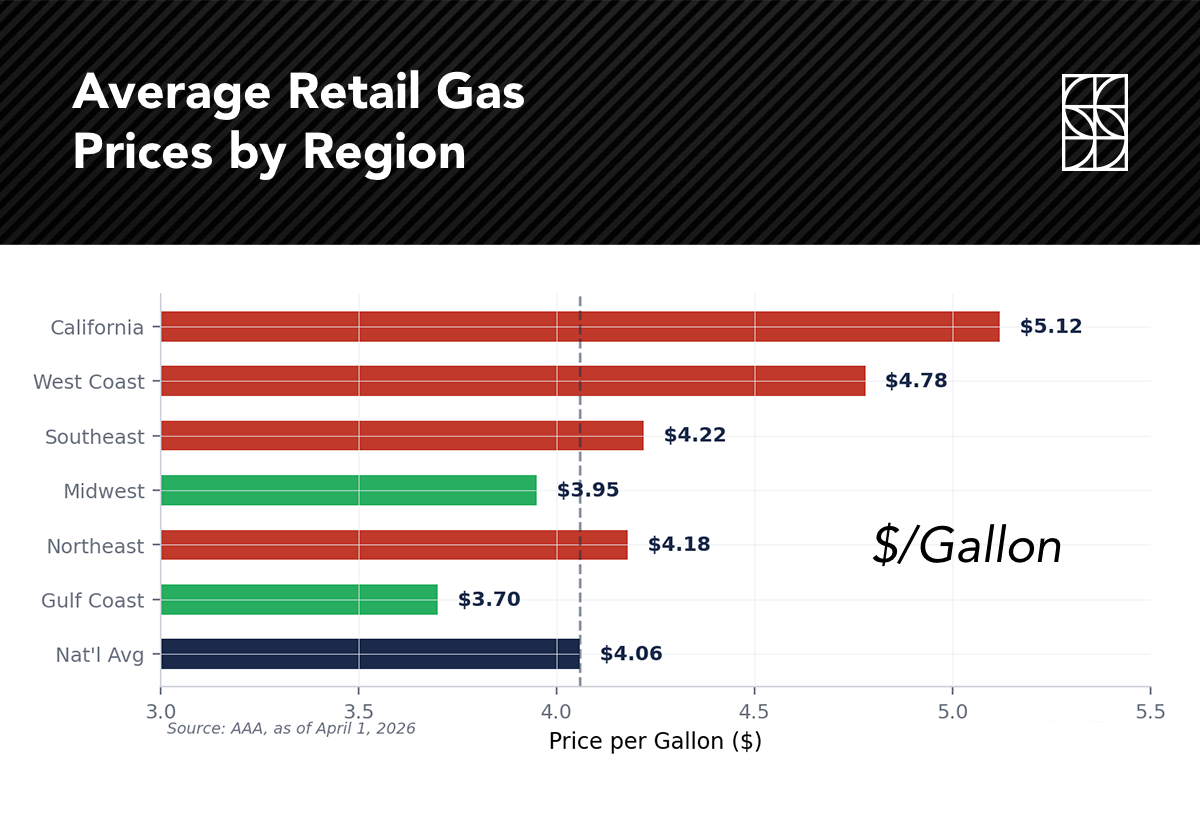
Source: AAA, as of April 1, 2026
Source: TradingView
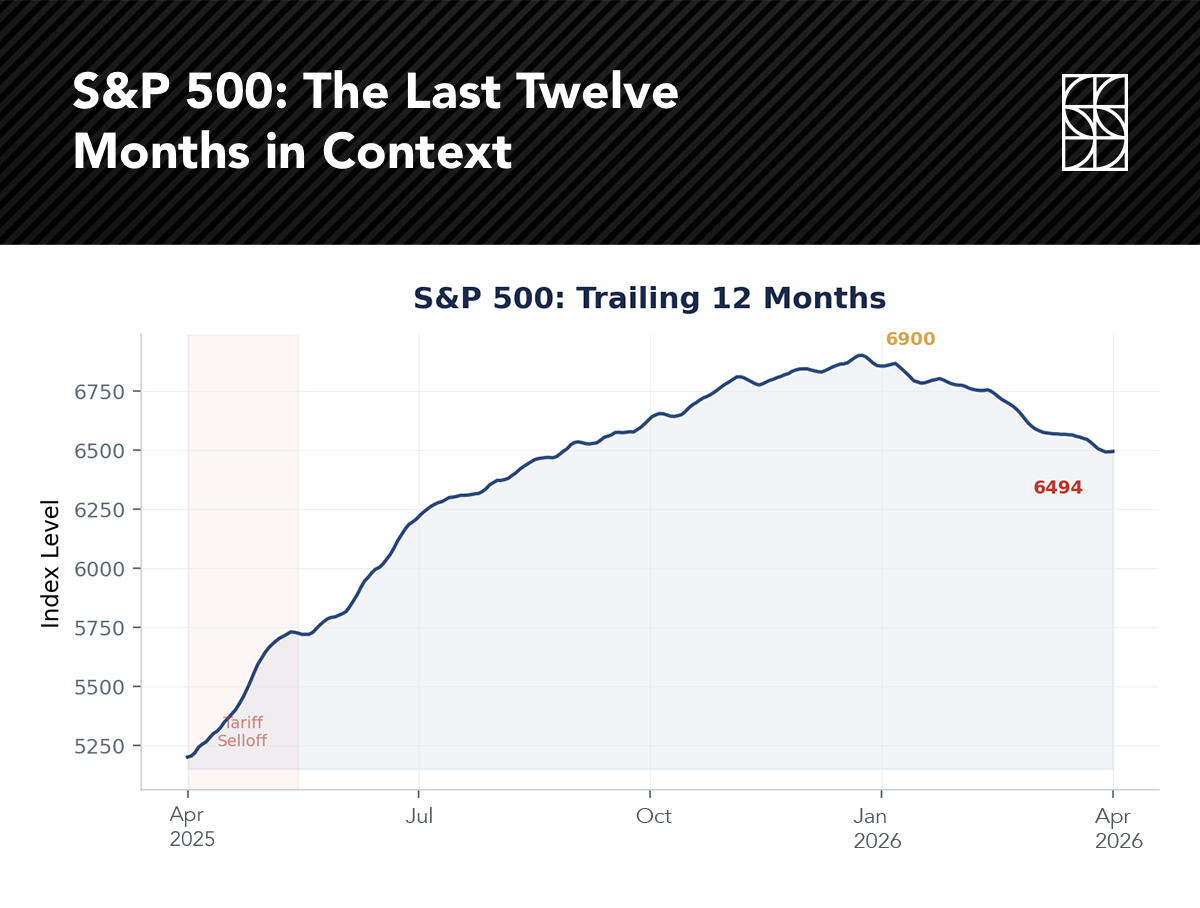
Before examining Q1 in detail, it is instructive to look back exactly one year. In April 2025, steep reciprocal tariffs triggered a sharp selloff: the S&P 500 plunged, volatility spiked, interest rates rose abruptly, and the dollar weakened. It was a period of acute investor anxiety. Yet the index recovered swiftly—posting gains of more than 25% from the April 2025 lows to the January 2026 highs. For investors who stayed the course, the reward was substantial.
Today’s environment bears striking parallels—substitute an oil shock for a trade shock—and the core lesson is the same. While elevated valuations mean there is an 80%+ probability of a 10% pullback in any calendar year, the probability that such a decline persists through year-end is only about 20%.
Source: TradingView
We understand the impulse to act during periods of market stress. Headlines are alarming, and the temptation to move to the sidelines feels rational. But the data tells a different story. Since 1950, the S&P 500’s average annual return is approximately 10%, while the average intra-year decline is 14%. In midterm election years specifically, and 2026 is one, the pattern is even more pronounced.
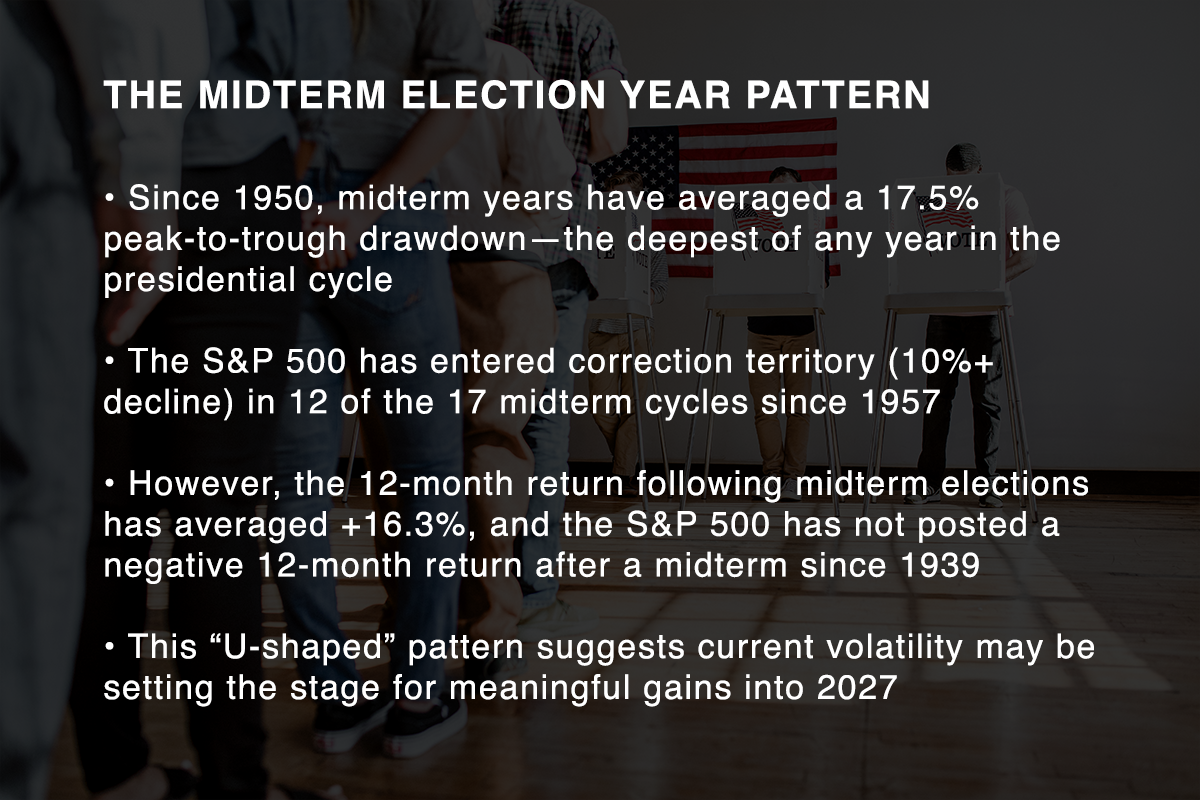
With the Q1 peak-to-trough drawdown at approximately 9%, we are well within the normal range of midterm-year volatility. Further weakness from here would not be historically unusual, but neither would a strong recovery.
The S&P 500 declined 5.0% in Q1—its first quarterly loss in a year and the steepest since 2022. Sideways price action in January gave way to a clear downtrend once strikes on Iranian targets began in late February. Unlike the sharp, compressed selloff of early April 2025, this pullback was more gradual, unfolding over several weeks rather than days.
Notably, the quarter ended on a strong note: the S&P 500 rallied 2.9% on March 31, its best single session since May 2025. The rally underscored that selling pressure had become exhausted and buyers were willing to step in at lower levels.
Before the March 31 rally, the S&P 500’s forward price-to-earnings ratio had dipped below 20× for the first time in nearly a year. The compression to sub-20× represents a healthier starting point for future returns.
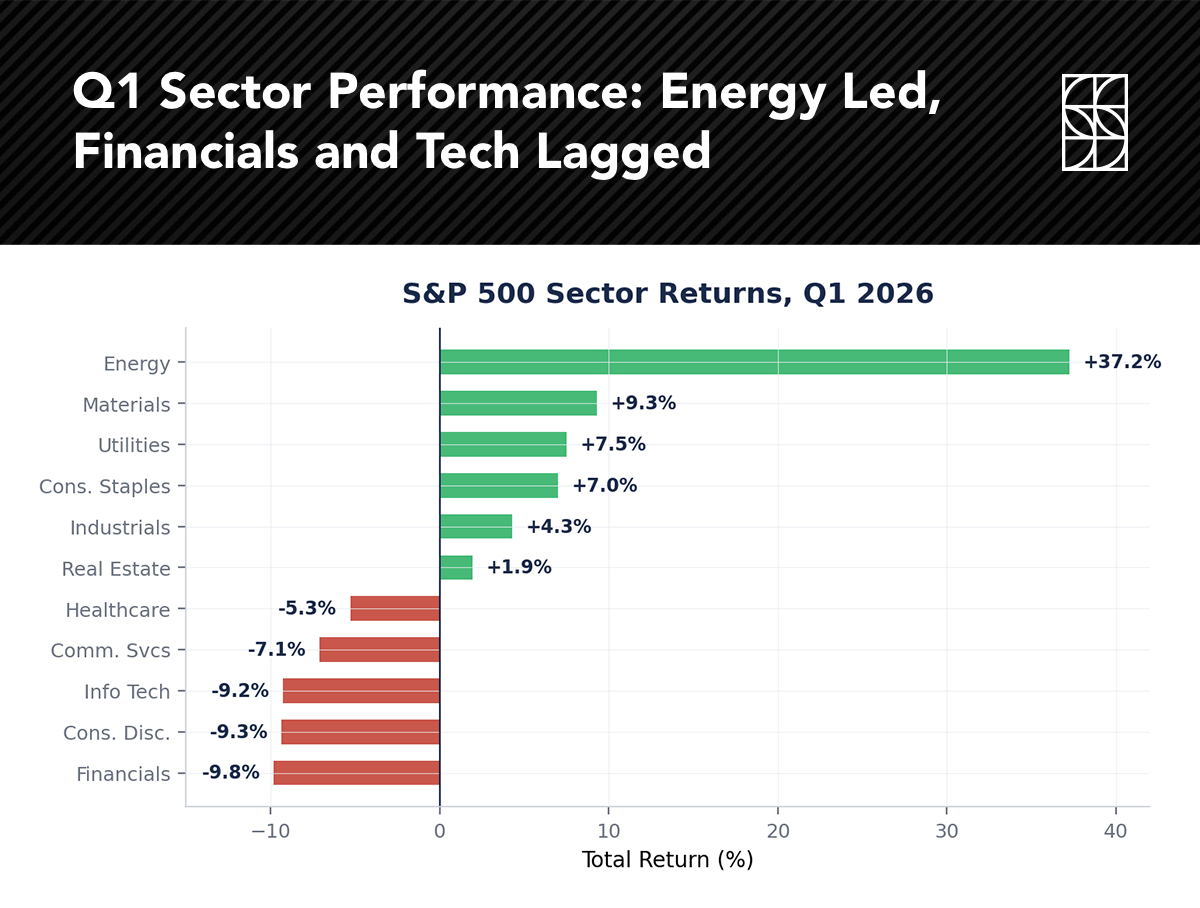
Energy was the clear standout, surging 37% and outperforming every other S&P 500 sector by a wide margin. Materials (+9.3%), Utilities (+7.5%), and Consumer Staples (+7.0%) also posted gains, a defensive rotation that is textbook for these types of geopolitical shocks.
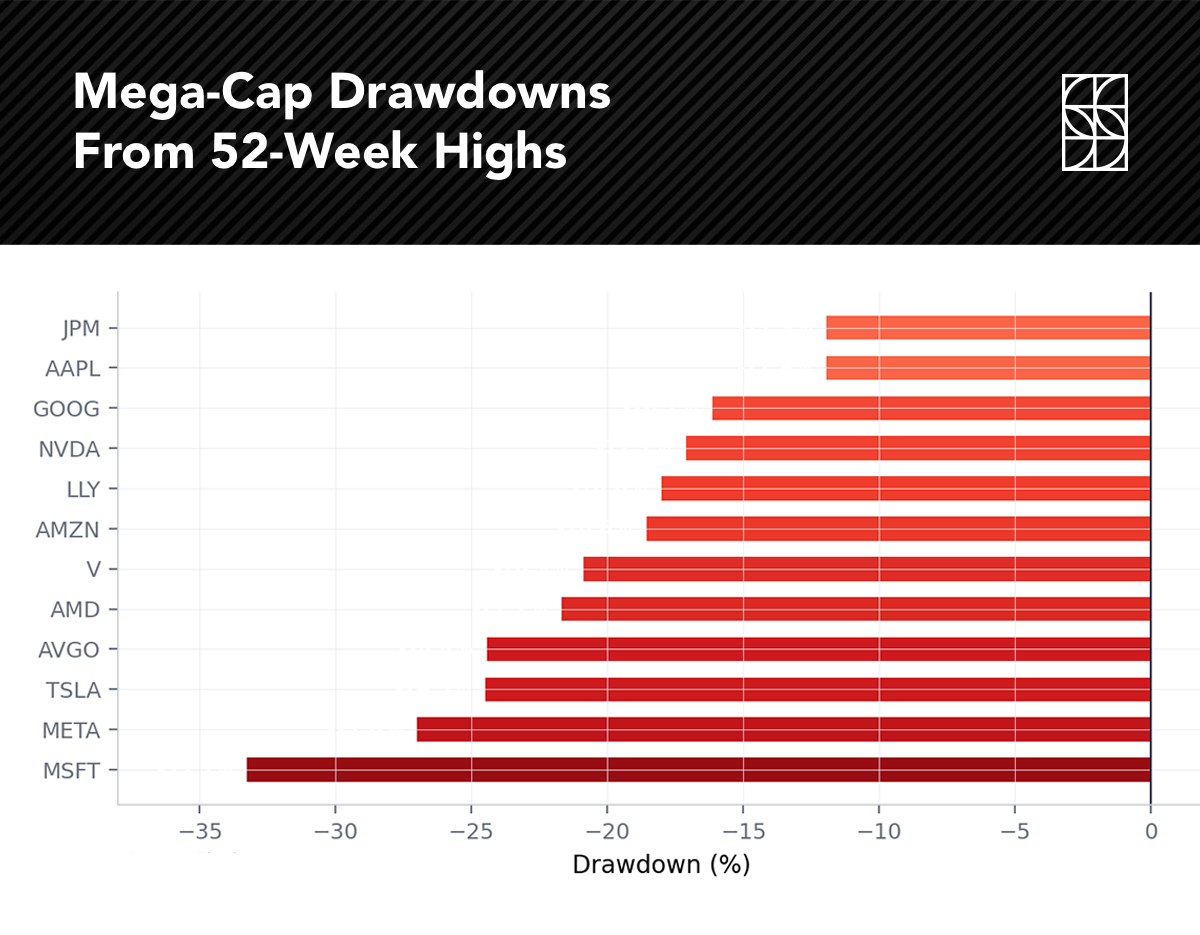
On the other end, several of the prior bull market’s leaders gave back ground. Financials fell 9.8%, Technology declined 9.3%, and Communication Services lost 7.1%. The Magnificent Seven lost significant ground: Microsoft was 33% below its all-time high, Meta off 27%, and Alphabet, Apple, Amazon, and NVIDIA all pulled back roughly 20%. Importantly, the S&P 500’s concentration in these names, which comprise over 40% of the index, means their weakness had an outsized impact on headline returns. For our clients, the diversified allocation across sectors, capitalization, and geographies that we have long advocated continued to deliver.
Source: StockCharts.com
Source: Finviz
One of the most important Q1 stories was the outperformance of areas outside U.S. large-cap growth. Small- and mid-cap U.S. equities posted better relative returns than the S&P 500, and international developed and emerging markets outperformed as well. This is not a coincidence. It reflects fundamentals that have been building for some time.
According to FactSet, S&P 600 Small Cap earnings growth is expected to accelerate to 29% year-over-year in Q4 2026, potentially outpacing even the Nasdaq-100 for the first time in years. Meanwhile, the U.S. was only the 20th best-performing country equity market in 2025, with South Korea and Spain leading. Developed and emerging market equities benefit from a weaker dollar, rate cuts, and commodity tailwinds—all of which remain in place.
For our portfolios, broad diversification across geographies and market capitalizations has been a cornerstone for precisely this reason. No single market leads forever, and the last twelve months have reminded us why.
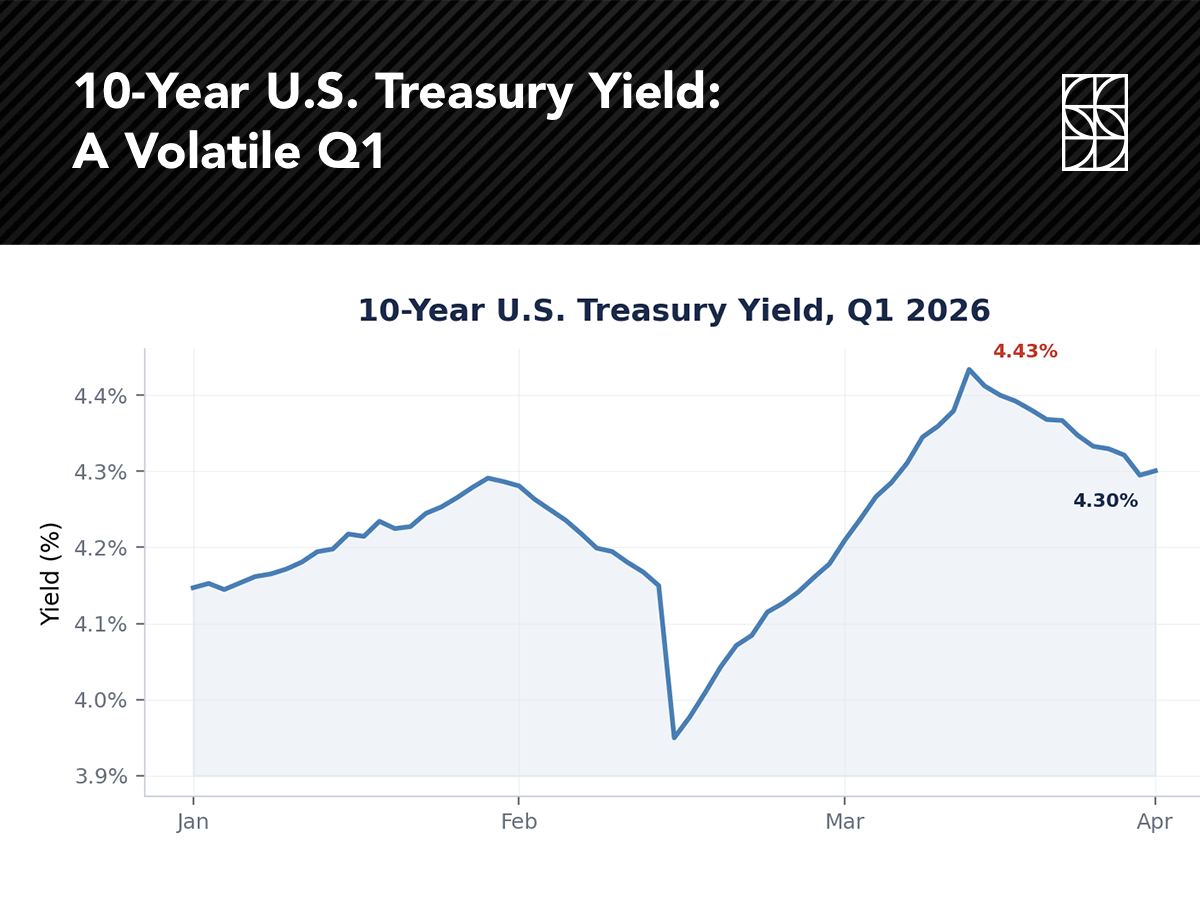
The bond market reflected the quarter’s crosscurrents. The 10-year Treasury yield began the year at 4.16%, dipped below 4.00% in February on weakening economic data, then spiked to nearly 4.50% in March as oil-driven inflation fears took hold. It ended the quarter near 4.30%.
The simultaneous decline in stocks and bonds during March was a pointed reminder that traditional stock–bond diversification can falter in inflationary environments. Despite the high correlation between stocks and bonds in recent years, we continue to view bonds as great diversifiers over the long-run, especially if we run into a slower-growth or recessionary period.
Despite rate volatility, most investment-grade fixed-income categories posted small positive returns for the quarter. The Bloomberg U.S. Aggregate Bond Index eked out a modest gain, and corporate credit spreads remained well-contained, reflecting continued confidence in the underlying economy.
Source: TradingView
The Fed finds itself in an unenviable position. The Consumer Price Index stood at 2.4% year-over-year as of February, but the oil shock has materially altered the trajectory. Goldman Sachs raised its headline PCE inflation forecast to 3.1% by December 2026, and the OECD now projects U.S. inflation at 4.2% for the year—a full 1.2 percentage points above prior estimates.
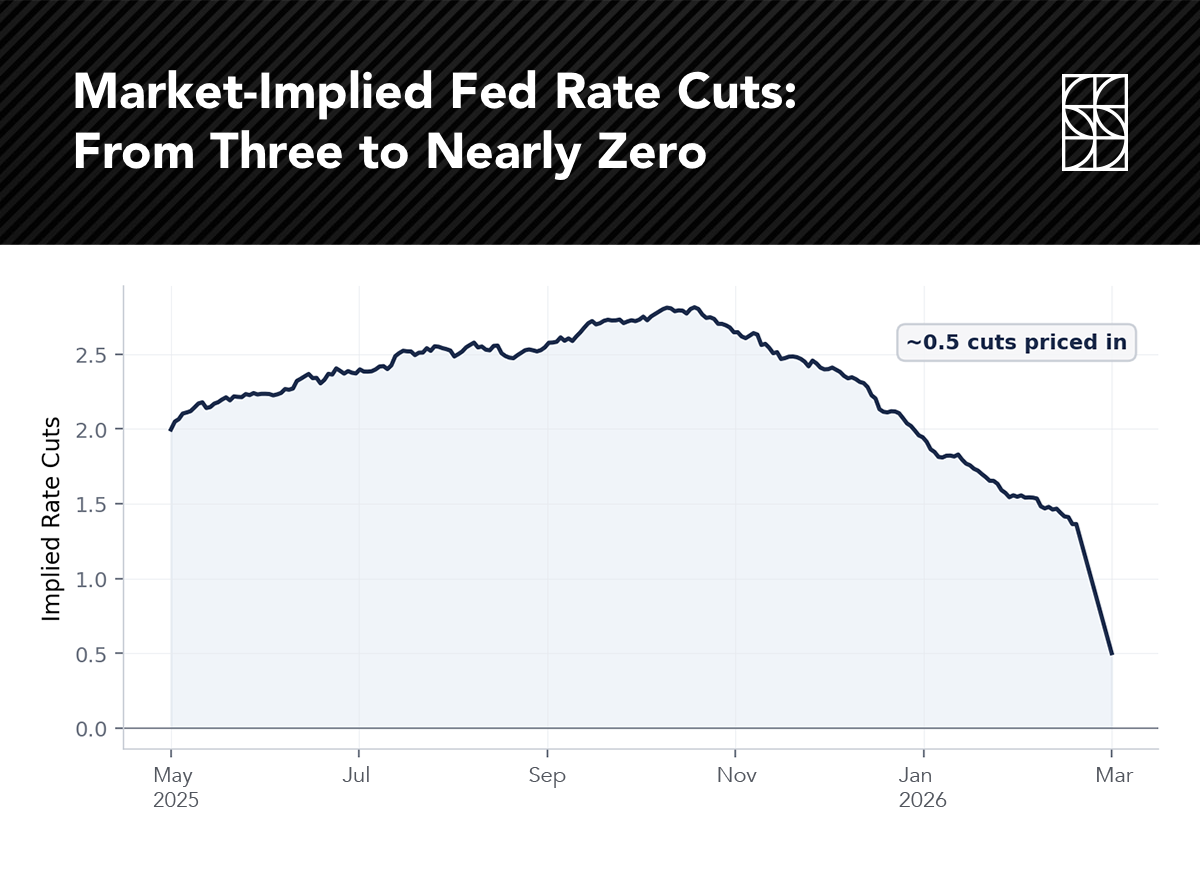
The futures market is pricing in minimal easing for the remainder of 2026—roughly half a rate cut. This marks a dramatic reversal from late 2025, when markets anticipated two to three cuts. We continue to err on the side of disinflation, as Truflation has a real-time inflation measurement of 1.78%. We believe energy costs will fall, technology will increase productivity, rent growth will still be tepid, and aging demographics will cause lower spending. All of these factors contribute to easing inflationary pressures and ultimately, lower interest rates, in our view.
Source: Augur Infinity (Fed Funds Futures)
Source: TradingView (Futures Contracts)
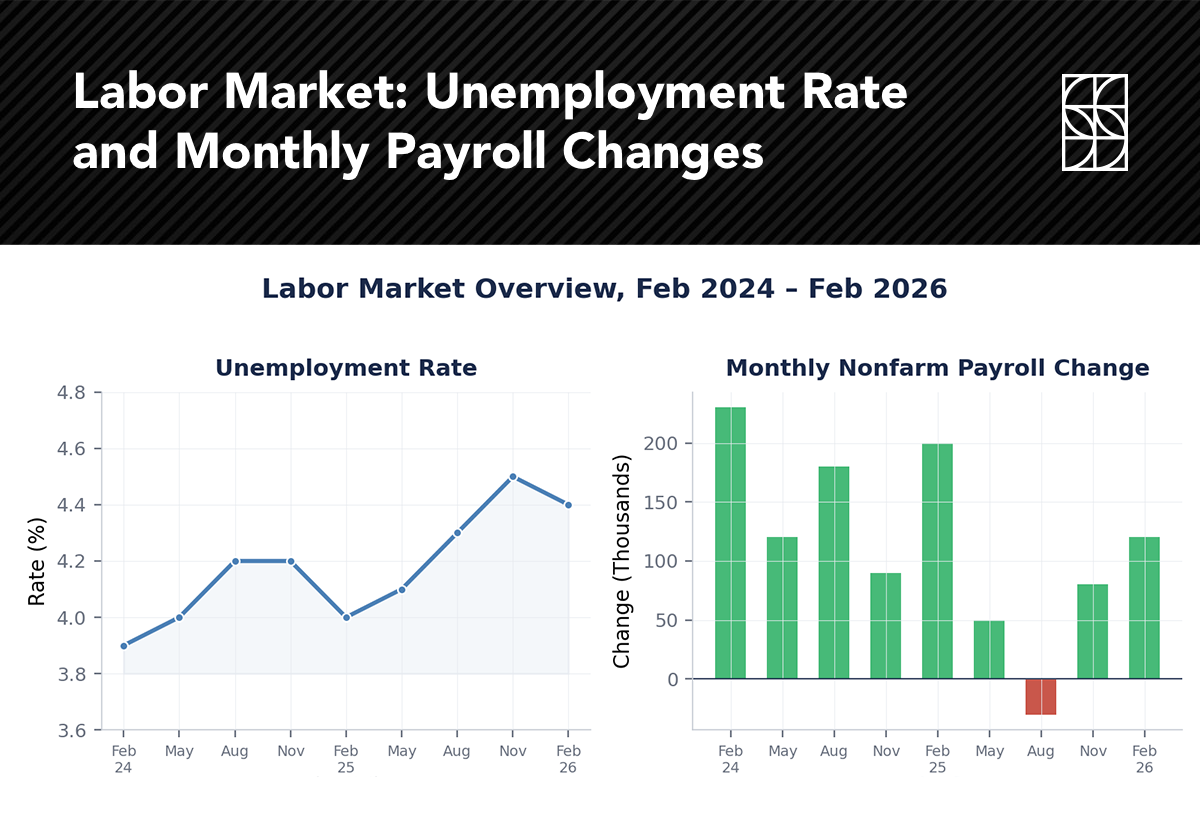
The unemployment rate has ranged from 4.2% to 4.6% in recent months, with February printing at 4.4%—a level that was once considered “full employment.” But the details reveal a “low hire, low fire” dynamic: firms are not aggressively adding headcount, yet layoffs and unemployment claims remain relatively contained.
Wall Street forecasts are for unemployment to rise modestly to 4.6% by year-end and baseline GDP growth forecast of 2.1%. Slow growth and rising unemployment but above recessionary conditions. Moody’s recession probability indicator reached 49% prior to the Iran escalation, driven primarily by soft labor data. But a 49% probability also implies a 51% probability that recession is avoided. JPMorgan Research currently pegs recession odds at 35%.
We view the labor softness as normalization from the post-pandemic hiring frenzy rather than a harbinger of contraction. Companies over-hired aggressively in 2021–2022, and the current environment reflects a rebalancing that may take time to fully resolve.
Source: Bureau of Labor Statistics
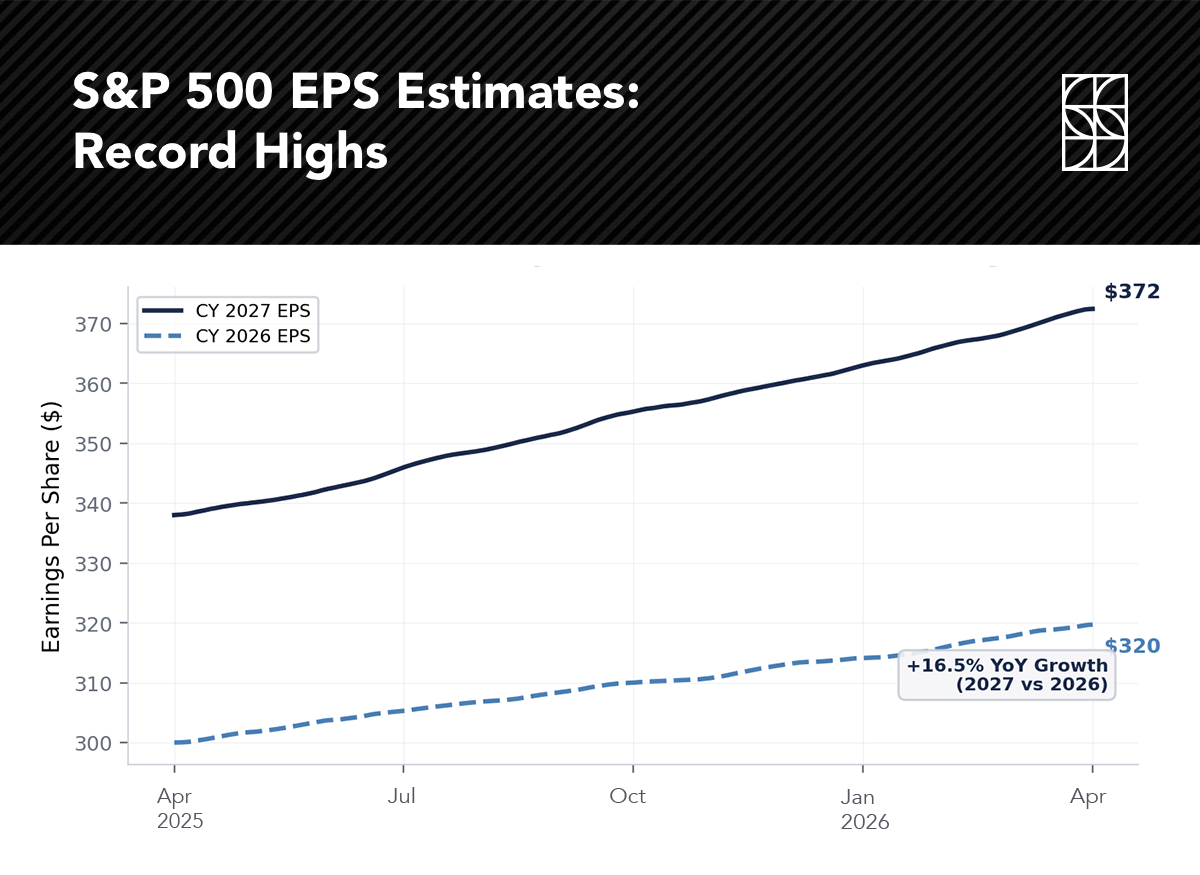
Amid the many crosscurrents, corporate profitability has never been stronger. This is the single most important data point for long-term equity investors. According to FactSet, S&P 500 earnings growth for Q1 2026 is estimated at 13.0% year-over-year, marking the sixth consecutive quarter of double-digit growth and the eleventh consecutive quarter of positive growth.
Full-year 2026 EPS estimates stand at approximately $320, with 16.5% bottom-line growth projected for 2027—implying next-year EPS near $372. These estimates could face revision if the conflict drags on, but the direction remains firmly higher. Notably, more S&P 500 companies have issued positive Q1 earnings guidance (60) than negative guidance (50), a ratio that is meaningfully above the five- and ten-year averages.
Source: FactSet
The first quarter was a reminder that markets do not move in straight lines. But it also reinforced several principles that have guided our approach.
SFO: INVESTMENT PRINCIPLES REAFFIRMED IN Q1:
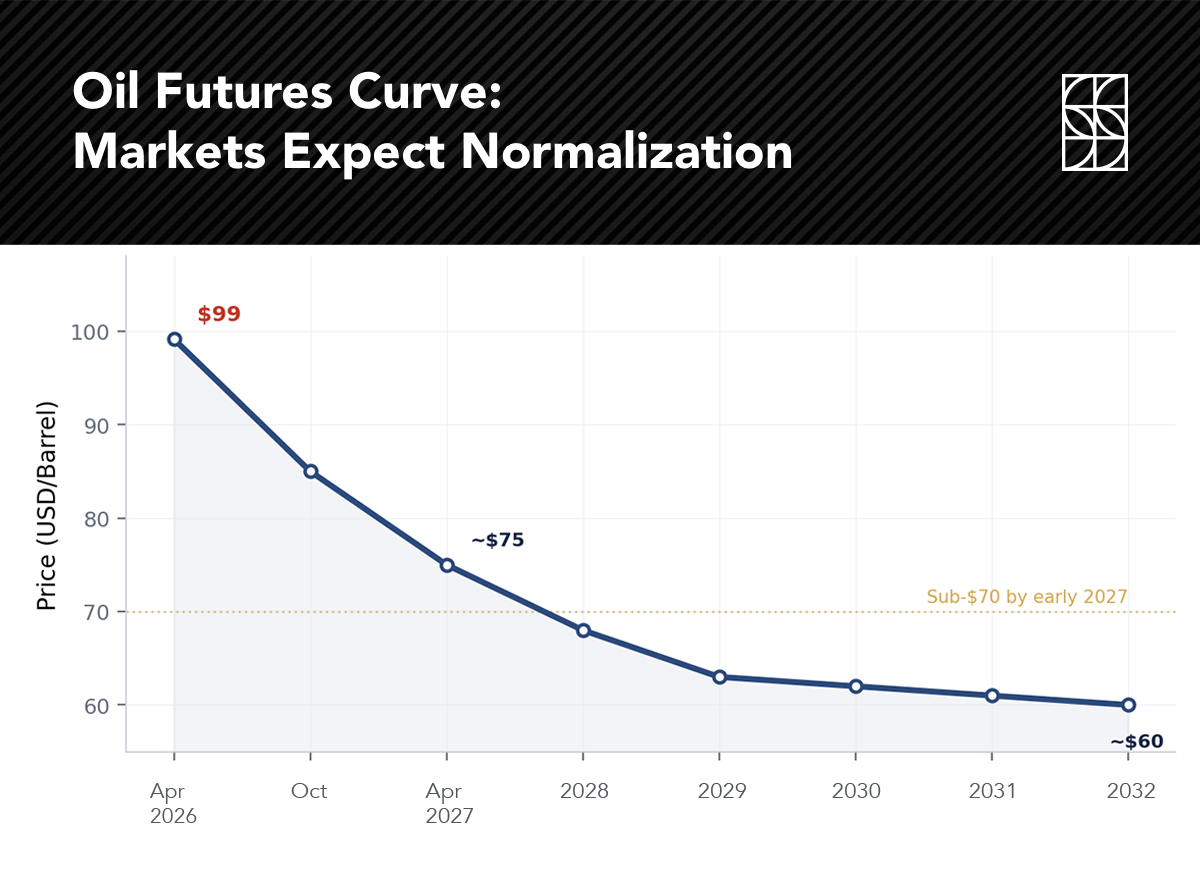
Looking ahead, the path of the Iran conflict will likely dominate short-term market action. But markets have a historical tendency to discount news in advance, and the oil futures curve suggests participants expect resolution sooner rather than later. For investors who stayed invested through the tariff shock of April 2025, the reward was a 25%+ rally. We cannot promise the same outcome today; no one can. But the playbook is the same: maintain discipline, trust your plan, and let time work in your favor.
As always, we are here to help you navigate the uncertainty. If the events of Q1 have raised questions about your allocation, risk tolerance, or financial plan, we welcome the conversation.
Want to hear even more? On this week’s Lagniappe Podcast episode, Doug and Greg Stokes review Q1 and give updates on the market’s turbulent reaction to the Iran conflict with a hopeful outlook for Q2. They also touch on getting back to business as usual, discussing the SpaceX IPO, interest rate expectations, and corporate efficiency movements.
Listen today on Apple or Spotify.
*Stokes Family Office does not offer legal or tax advice. Please consult the appropriate professional regarding your individual circumstances.